
Organizations make income by offering products and services to their customers. Do you think every product/service will be exactly the same as others in the same product/service line? Surely not. There is always an inherent variability associated with products and services. The purpose of specifying tolerance levels is to account for these variations. Buildings are the same, and construction quality differs from firm to firm and process to process.
What if the variations are to the extent that is unacceptable to the client? Consider a few scenarios – the budget of the client was INR 50 lakh but the cost of construction happened to be INR 60 lakh. A project that was supposed to be delivered in 5 months but took around 10 months to complete. The quality of service offered was far below the set expectations. Would these be acceptable to the client?
The need to manage variability
Higher variability in product/service results in poor quality of product/service. As a result, the organization has to incur additional expenses to correct these defects. These additional expenditures could badly impact the profitability of the business and could even push an organization out of business.
While it is inherent to have variability, companies should try to maintain it at the lowest levels possible in order to provide the best service to the customer. Six Sigma is a quality management philosophy and a methodology that focuses on reducing variation, measuring defects and improving the quality of products, processes and services. Focused efforts on outputs critical to the customer will help reduce the variations, leading to financial gain for the organization. This methodology was pioneered by Motorola in the 1980’s and was embraced heavily by GE in the 1990’s, heavily utilized in all large scale manufacturing processes.
Six sigma for construction quality management
Construction, that goes through various stages like design, costing, planning and execution, has a lot of processes involved in it and each of these processes have desired performance levels. As described before, variations are inevitable and what we must focus on is to reduce these process variations. This impacts construction quality in varying degrees.
The first step to achieve this is by standardizing the processes. This will reduce some part of the variability in it. Moreover, mapping the variations in each of these from the desired performance will indicate the scope of improvement. Six Sigma methodology comes as a handy tool to address these so as to improve the construction quality levels and thus elevate the customer experience. Before going into details of how to use this methodology, let’s have a look at the theory behind it. After that, we apply those principles on an example from construction process.
Statistical Theory Behind Six Sigma Quality Control
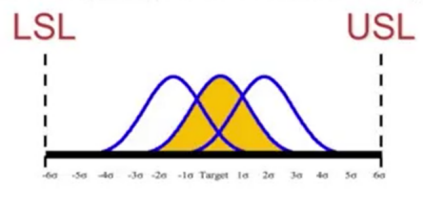
Six Sigma represents a stretch goal of six standard deviations from the process mean to the specification limits when the process is centered, but also allowing for a 1.5 Sigma shift towards either specification limits. This represents a quality level of 3.4 defects per million. The below given table details the various sigma levels and the improvement as we move from 1 Sigma level to 6 Sigma level. As evident from the table, as we move from one level to the other, huge reduction in defects could be realized.
| Sigma Level | PPM | Yield (%) |
| 6 σ | 3.4 PPM | 99.99966 |
| 5 σ | 233 PPM | 99.977 |
| 4 σ | 6210 PPM | 99.38 |
| 3 σ | 66810 PPM | 93.3 |
| 2 σ | 308770 PPM | 69.1 |
| 1 σ | 691462 PPM | 30.9 |
DMAIC Methodology
DMAIC – Define, Measure, Analyse, Improve and Control – is one of the most commonly used Six Sigma guiding principles. Under each phase, there are a series of essential steps required and there are different tools that helps us to carry out these steps.
Define: Identify an issue causing decreased customer satisfaction, a reduced bottom line, safety incidents, supplier quality failure, and so forth
Measure: Collect data from the process and verify the validity of the data
Analyse: Study the process data to identify root cause(s)
Improve: Act on the root causes to change the process for the better
Control: Monitor the system to sustain the gains
An example from construction to demonstrate six sigma methodology
Define
Let’s take an example of plastering activity. There are mainly 11 types of defects that could occur during this process – plump, bulging at overlapping of joints, non-structural cracks, undulation, grinning, settling, edge roughness, debonding, lack of hardness, expansion and popping.
These defects could result in poor construction quality, customer dissatisfaction. As a result, additional cost and time due to rework is a given. Therefore, it is critical to identify the current performance levels and figuring out measures to improve will result in significant enhancement of quality and customer experience. This is the Define phase.
Measure
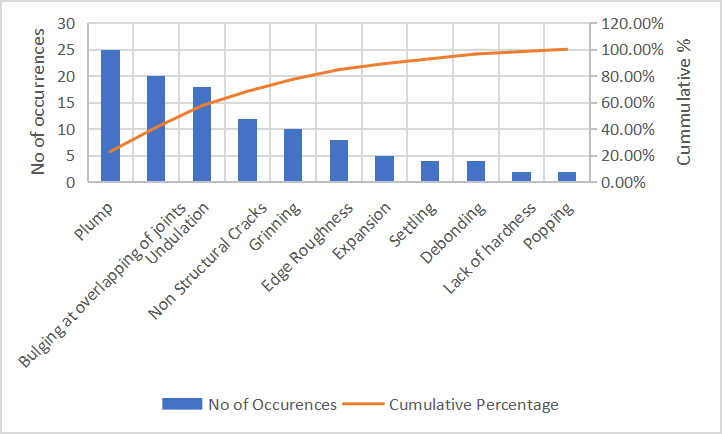
Here the problem that we are trying to address is the occurrence of defects in plastering activity. After that, we need to evaluate our current performance levels which is what we do in the Measure phase. You will need to make use of an established process or a software to measure adequately. Suppose we measure the number of defects in 30 plastering activities and we got the below mentioned result.
| Defect | No of Occurrences |
| Plump | 25 |
| Bulging at overlapping of joints | 20 |
| Undulation | 18 |
| Non-Structural Cracks | 12 |
| Grinning | 10 |
| Edge Roughness | 8 |
| Expansion | 5 |
| Settling | 4 |
| Debonding | 4 |
| Lack of hardness | 2 |
| Popping | 2 |
| Total | 110 |
The total number of defect possibilities = 30*11 = 330
Defects per million opportunities (DPMO) = (110/330) *1000000 = 333333
By comparing this value with the values in Table 1, we can see that this particular process is closer to 2σ (read as 2 sigma) performance level. In other words, the scope for improvement in this particular activity is huge and even a 1σ level improvement could enhance the performance from about 66.67% to 93%. In addition, it is evident from the graph that the first three defects accounts for more than 50% of the total cases. This gives an idea on what needs to be addressed on priority.
Analyse
As the current performance levels are computed and the contributors for the same are identified, the next stage is the Analyse phase where we dive deep to understand the root causes for each of these defects. Tools like fishbone diagram or Ishikawa diagram, Why-Why analysis (which is also known as 5 Whys), brainstorming etc will help identify the root causes.
As evident from the data, one of the major defects in plastering is the ‘plump’. Not checking vertical levels properly will result in this. Further assessment of the root causes reveals that, while vertical level was checked initially, it wasn’t cross checked at the later stages. In addition, laborers didn’t follow the SOP even though it was clearly specified.
The next major defect is bulging as a result of the overlapping of joints. This mainly occurs at areas where the laborers start the work the next day (when plastering was not completed the previous day and the work spilled over to the next day). The root cause analysis helped to identify that proper instructions were not given to the workers on how to resume plastering work that was not completed the previous day. Therefore, skill set and experience level of the worker determined the work quality.
The third major reason identified was ‘Undulation’ that refers to the unevenness in surface. Root cause investigation indicated that tools as well as steps mentioned in the SOP wasn’t clear enough to guide the laborers to do the work defect free.
Improve
Now the steps/measures to arrest these cases are to be devised and implemented (Improve Phase). As understood from the root cause analysis, misses in SOP and lack of SOP adherence were the reasons for the major 3 defects. Therefore, gaps should be plugged by amending the SOP. Further, laborers need to be trained properly on the amended SOP.
The additions required in SOP are:
To arrest plump
- Place the plump bob vertically and take the thickness by using a tile piece
- Plaster levelling should be ensured with respect to the surface of the tile piece by using float rule.
To arrest bulging at overlapping of joints
- Try to cover the complete area within the same day
- If unable to complete on the same day, the end portion must be made in a slanting position or cut it as zig-zag joints
- Leveling should be done with respect to the top points and plump bob points
To arrest undulation
- Don’t use trowels for finishing
- Check levels using plump bob
- Use float rule to do levelling
Laborers should be educated on the importance of adherence to SOPs. Most of them might not have experience on working in a structured manner. Therefore, they should be properly trained to work in the expected manner and teach them the benefits of doing so. Above all, the supervisors should be trained on these aspects so that they can monitor the work effectively.
Everyone should be crystal clear on the process and the key objective that is expected from these corrections. This will help in better adherence and will reduce the resistance to change. In addition, timely collaboration and communication is key.
Review after 1st round of improvements
Improvement phase needs to be properly managed. In this phase, the concerned person should closely monitor the corrections suggested such that they are properly implemented. The data needs to be closely analysed to see whether there are expected improvements in the performance levels and actions need to be taken accordingly.
Suppose upon implementation of the above improvement steps, the below data was collected for a set of 30 plastering activities.
| Defect | No of Occurrences |
| Plump | 2 |
| Bulging at overlapping of joints | 1 |
| Undulation | 1 |
| Non-Structural Cracks | 10 |
| Grinning | 8 |
| Edge Roughness | 7 |
| Expansion | 5 |
| Settling | 4 |
| Debonding | 3 |
| Lack of hardness | 2 |
| Popping | 1 |
| Total | 44 |
The total number of defect possibilities = 30*11 = 330
Defects per million opportunities (DPMO) = (44/330) *1000000 = 133333
Comparing it with the earlier data, the key inference is that the DPMO improves from 333333 to 133333 which also resulted in around 20% improvement in defect- free rate (Improved from 66.67% to 86.67%). It is evident from the sigma table that, as a result of the corrections that we brought in, the process has moved closer to 3σ level.
Another way to look at it is, during pre-improvement phase we had around 110 defects in every 30-plastering activities and post-improvement phase we were able to bring it down to around 40. In other words, we have saved the cost and time related to the rework of around 70 defects!!
Keeping control
Focused efforts and continuous monitoring during the improvement phase, will help in implementing the remedial measures and thereby, improving the output. However, one major challenge is about sustaining these performance levels. There is a high probability of drop in performance levels if no proper monitoring mechanisms are in place. Therefore, the significance of Control phase.
It is essential to develop mechanisms to measure the performance levels and take corrective actions when it goes below the achieved levels. Statistical Process Control (SPC) is one such tool that helps in monitoring the variation.
The need for continuous improvement
What’s the next step? Settling down at the current performance level of 86% as there was an improvement of 20%? Definitely not. The current performance level is only heading towards 3σ level. There are 3 more levels to go even after hitting 3σ performance level. In other words, the journey of continuous improvement has just begun!!
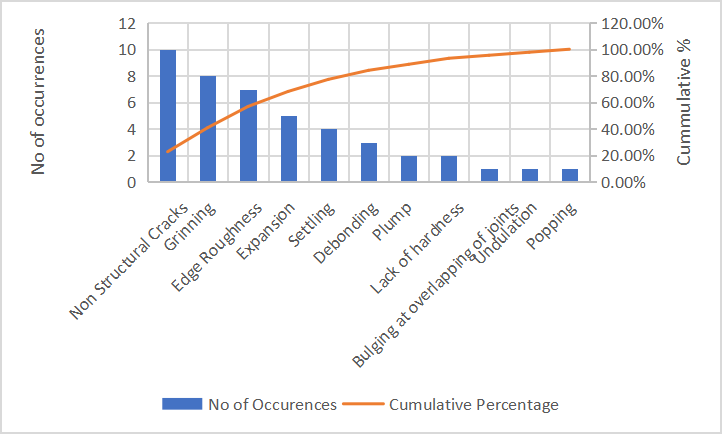
The above given graphical representation of the post-improvement phase data shows that now we have another set of 3 defects that constitutes for more than 50% of the total defects and the 6 out of 11 defects constitutes for more than 80% of the total defects. This gives a clear indication on the next set of improvement opportunities.
The data used for the above case study is only for illustrative purpose and not based on actuals. This case study demonstrates how the Six Sigma methodology can be effectively used to reduce defects/variations in a structured manner and thus improve the performance which in turn elevates the customer experience.
Similar to the illustrated example, variations/defects in various processes in construction could be addressed by this methodology. A few other examples for scenarios that could be addressed are project cost escalation, project time escalation, delay in BOQ creation, abnormal inventory levels at site, over consumption of materials, fall in labor efficiency etc.
Importance of personnel in improving quality standards
Mindset of the resources involved will determine the success of implementing six sigma methodology. Instead of being problem driven, people involved should be customer driven. Instead of reacting to issues, one should search and work for prevention of issues and reduction of wastes. In addition, there should not be settling down at anything less than 100% yield.
As evident from the sigma table, each jump in sigma level could bring significant improvements. Therefore, the concept of continuous improvement and customer focus need to be ingrained in a company’s culture. Moreover, it need to be embraced at all levels in the organization.
Other major factors are teamwork and adaptability to changes. This is not a one-man show, employees across teams need to work together towards this goal. Moreover, the purpose and significance of the efforts need to be very clear to all employees to make this possible. That’s the only way to drive improvement in construction quality management.
Six Sigma for Construction Quality
In conclusion, as an organisation prepares for the Six Sigma journey thus towards improved construction quality, below are the key aspects one should follow:
- Recognize that variation exists in everything that they do – Standardize work.
- Identify what the customer wants and needs – Reduce variation.
- Use a problem-solving methodology to plan improvements – No one is perfect.
- Follow the DMAIC model to deploy the improvement – Use winning frameworks.
- Monitor the process using process behaviour charts – Continuously improve.
- Update standard operating procedures and lessons learned – Review and Reflect.
- Celebrate successes – Motivate the team.
- Start over for continual improvement – Aim for the best.
Have you implemented six sigma quality control in you construction project?
References:
- The Certified Six Sigma Yellow Belt Handbook – Govind Ramu
- Six Sigma Yellow Belt Course offered by Kennesaw State University
Great read!
Excellent in content and depth.
Excellent read! Can we also have different weightages for each defect based on the impact on cost/time/quality?
The article is an eye opener and demands appreciation.